Collaboration Spotting X
TL;DR
I built the Collaboration Spotting X platform to provide experts with a way of easily interacting and modelling networks visually. I integrated concepts from information retrieval, network analysis, and visual analytics using React, MobX, and FastAPI. It's divided into multiple Docker containers to contain the client-side, server-side, MongoDB database and optionally Matomo, making it easy to develop and deploy. You can easily customize the settings and upload your own data sets as CSV files. Users can retrieve subsets data through an intuitive search interface.
1. Jul 2022
The Aim
Traditional network analysis tools as well as representations tend to approach networks as structures with a static schema. If needed network schemas can usually be updated to a lot of work using Python and libraries such as NetworkX. However, such tasks require knowledge of programming that many experts, knowledgeable in various fields may not have. The aim of developing Collaboration Spotting X (CSX) was to explore how introducing a new user-friendly approach to retrieving, analysing and modelling data as networks can potentially help experts get new insights from their data.
The User Interface
Users start their exploration journey by searching for subsets of their dataset through a traditional search box. The results are shown in the form of networks created through a default schema. An example of search results represented as a network can be seen in the image below.
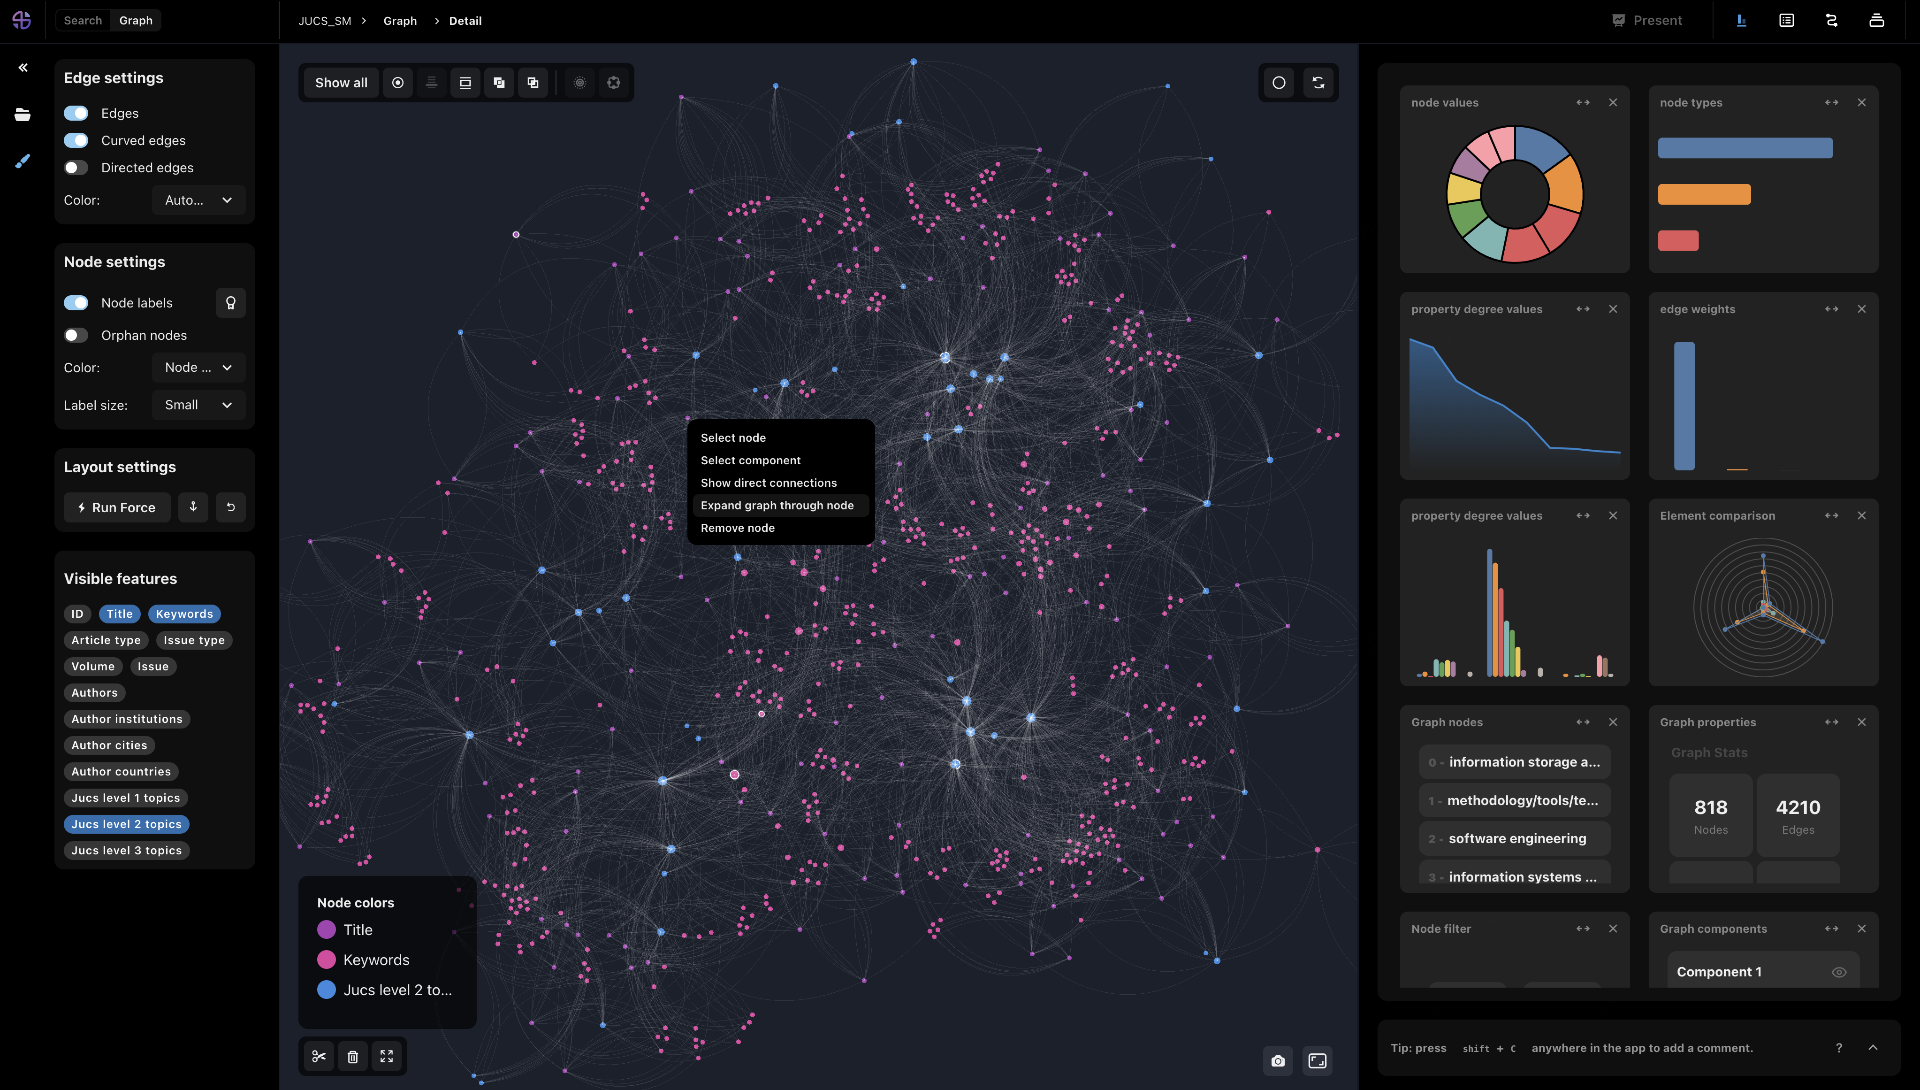
The main CSX interface showing the view settings on the left, the graph view in the centre and the widget panel on the right.
Users can interact with the retrieved data through various customizable views, such as networks, tables, and statistics widgets. CSX additionally offers a commenting feature and a history of the user’s actions to facilitate collaboration and streamline the user’s workflow.
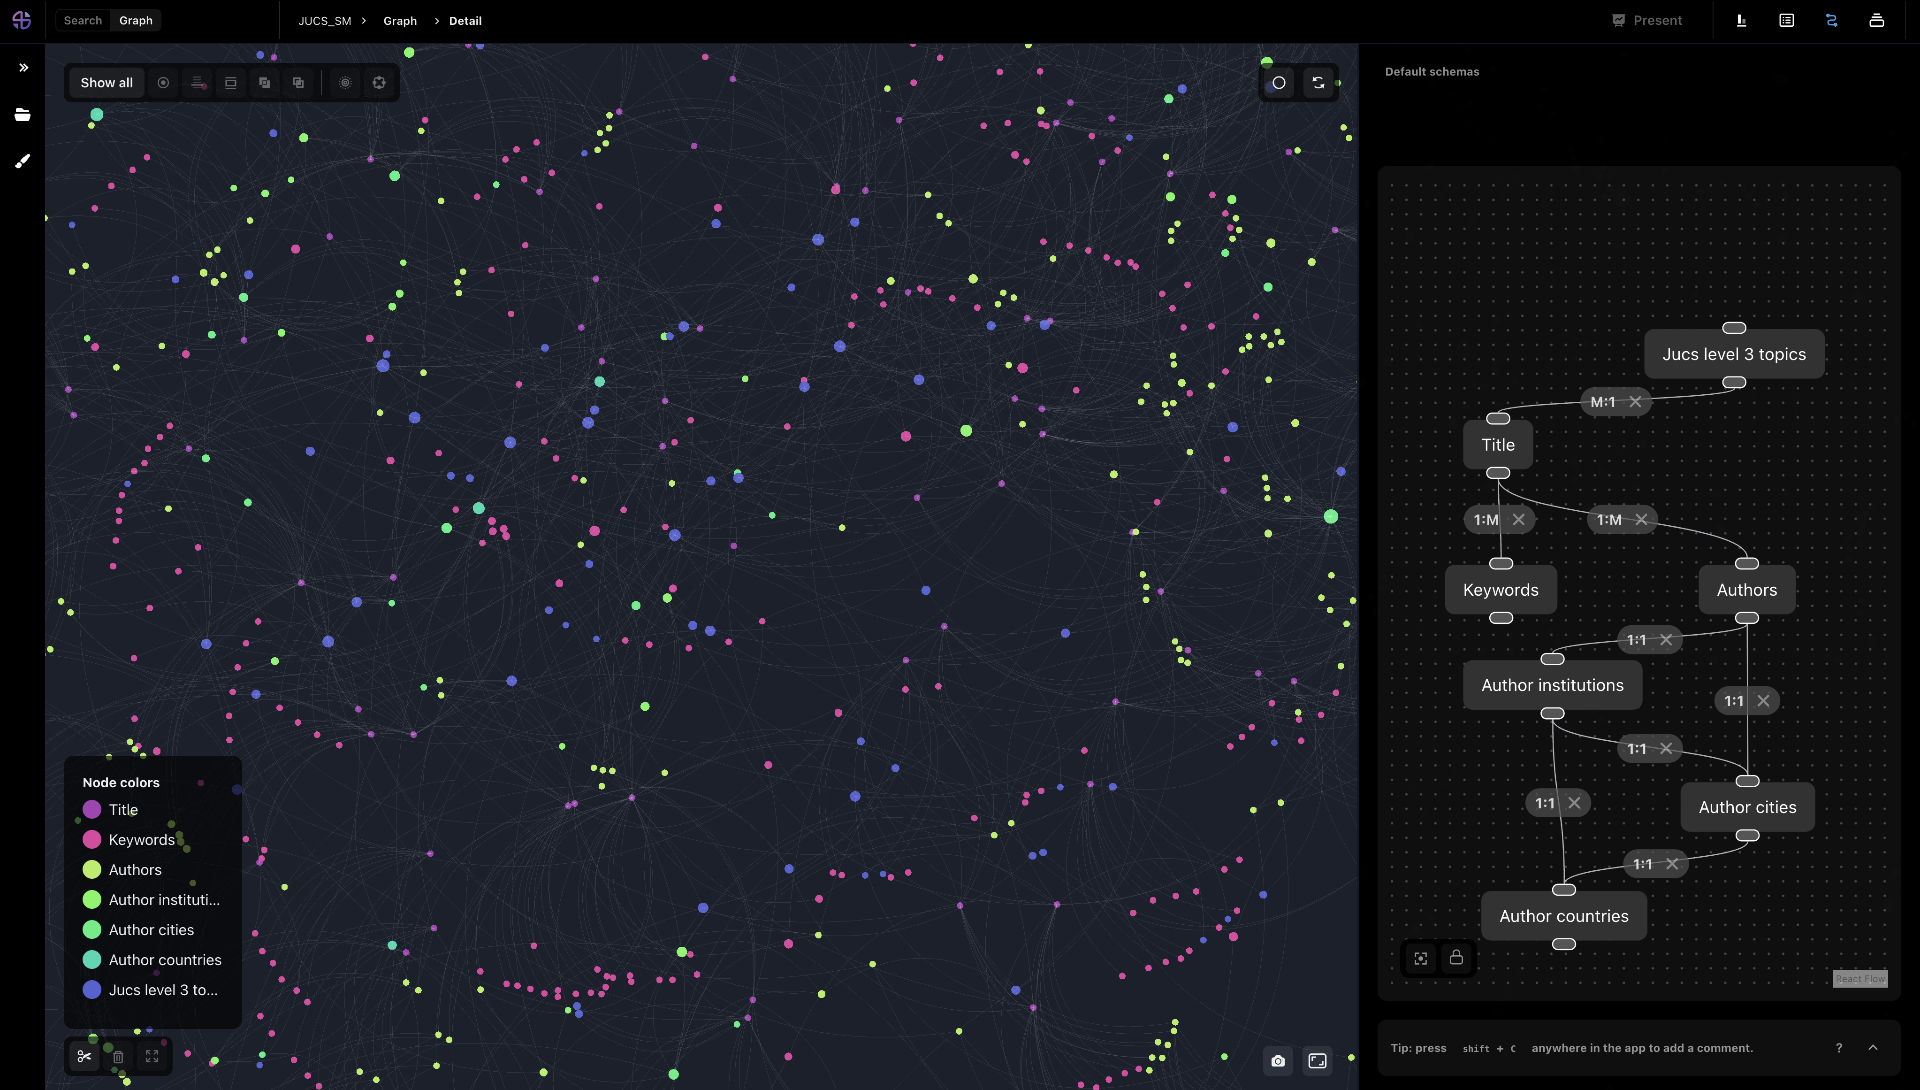
A graph containing complex connections alongside the schema designer on the right.
Users can model retrieved data using the CSX schema designer without worrying about the original dataset’s connections. CSX automatically detects data types and suggests possible relationships between features to make the modelling process a breeze.
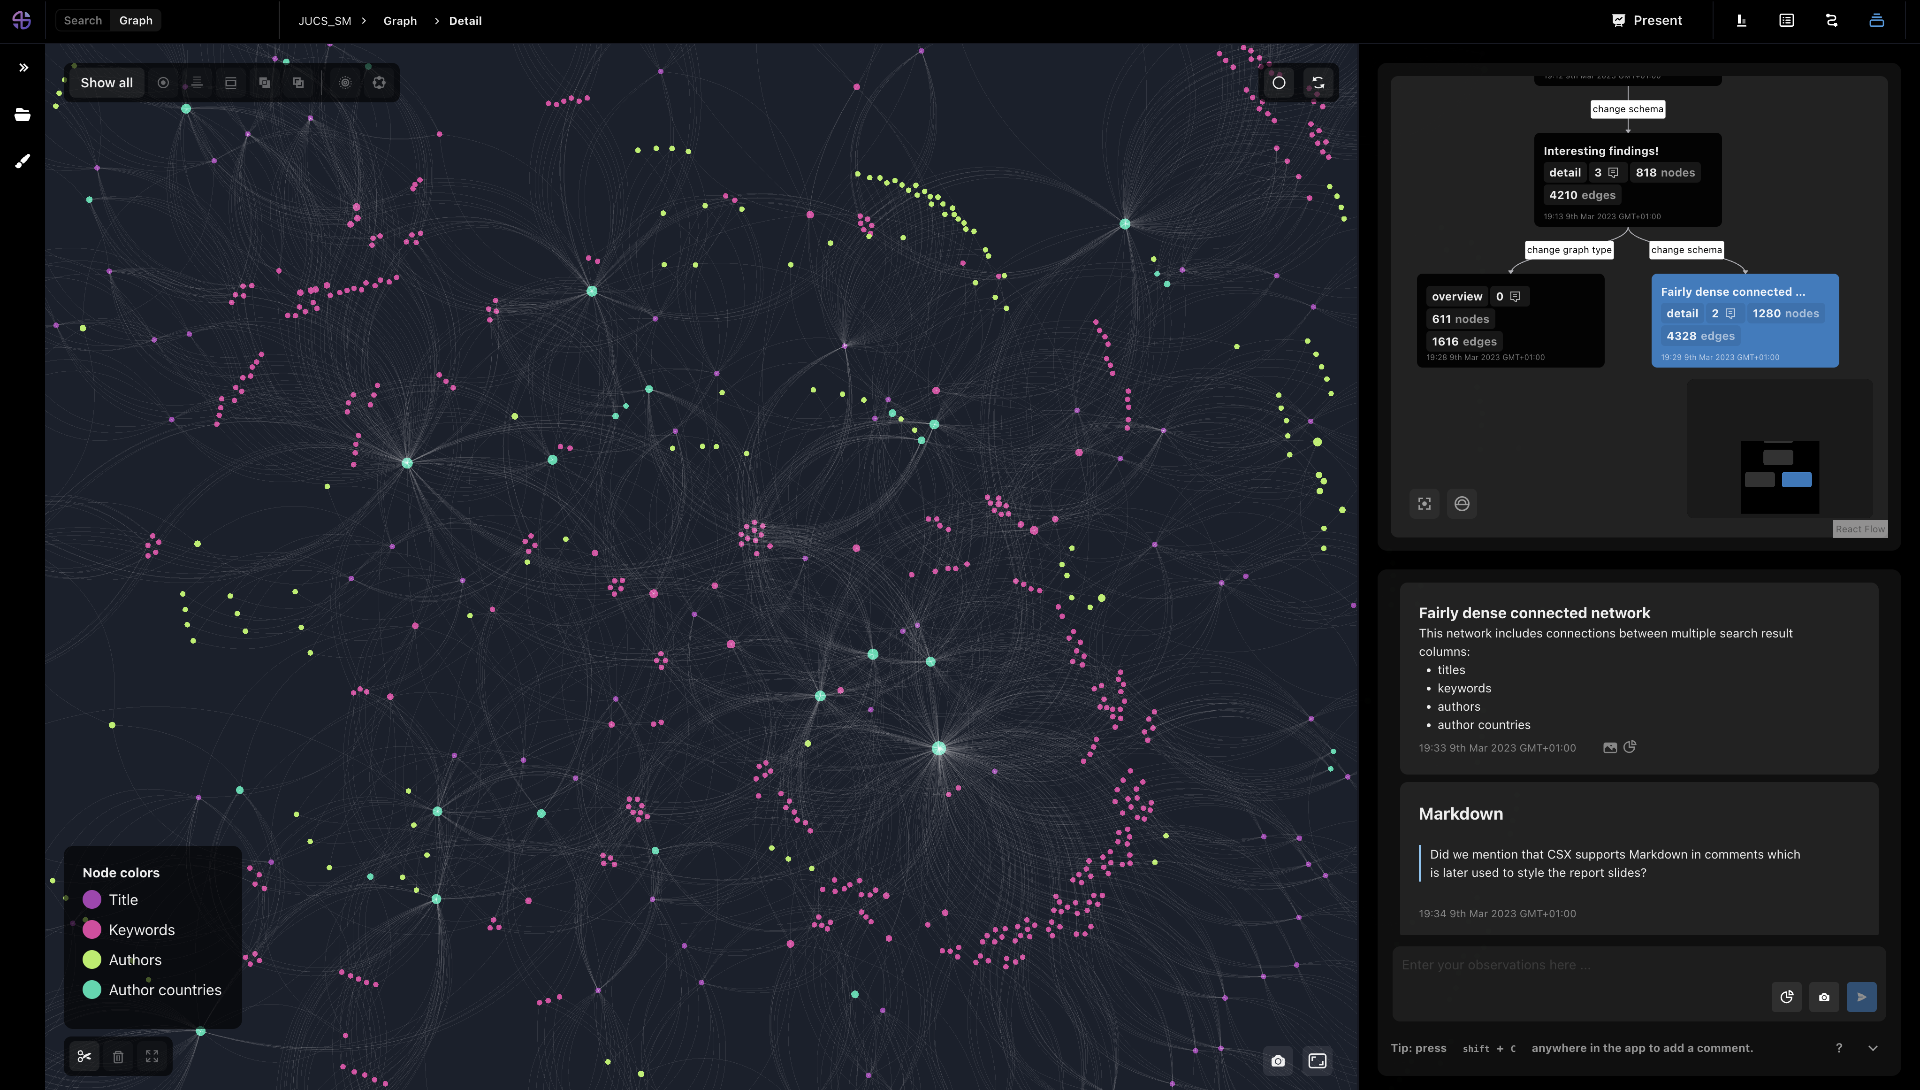
The CSX history view with a forked history on the top right and the Markdown comments panel on the bottom right.
Findings and Lessons Learned
During the iterative development process, the concepts introduced in CSX were evaluated in multiple user studies using various tools, such as surveys, interaction data analysis as well as interviews. The results showed how CSX can support users by enabling them to easily retrieve and modify data as networks. These studies also provided a deeper insight into the usability aspect of CSX which could be used as a basis for building other similarly complex tools. If you’re interested in using this project for your data analysis needs or would like to contribute, please don’t hesitate to contact me. The full code can be seen on the GitHub page. Additionally you can visit the project webpage to read more about CSX.
Papers
In addition to the creation of Collaboration Spotting X this project also resulted in multiple papers listed below as well as a master thesis as part of which I acted as a co-supervisor.
Bobic, A., Le Goff, J-M., & Gütl, C. (2023). Towards a smart network schema builder using anonymous and implicit interaction data. In OSSYM 2023